Tuesday, November 28, 2006

The Impact Evaluation Gap

Policy evaluation is the kind of stuff we rarely address properly in universities. If nothing else, this is an area were the dismal science can really shed light and prove to be useful.

When Will We Ever Learn? Improving Lives Through Impact Evaluation

Download (PDF, 536 KB) 05/31/2006

Each year billions of dollars are spent on thousands of programs to improve health, education and other social sector outcomes in the developing world. But very few programs benefit from studies that could determine whether or not they actually made a difference. This absence of evidence is an urgent problem: it not only wastes money but denies poor people crucial support to improve their lives.

This report by the Evaluation Gap Working Group provides a strategic solution to this problem addressing this gap, and systematically building evidence about what works in social development, proving it is possible to improve the effectiveness of domestic spending and development assistance by bringing vital knowledge into the service of policymaking and program design.

In 2004 the Center for Global Development, with support from the Bill & Melinda Gates Foundation and The William and Flora Hewlett Foundation, convened the Evaluation Gap Working Group. The group was asked to investigate why rigorous impact evaluations of social development programs, whether financed directly by developing country governments or supported by international aid, are relatively rare. The Working Group was charged with developing proposals to stimulate more and better impact evaluations. This report, the final report of the working group, contains specific recommendations for addressing this urgent problem.


Read more here: http://www.cgdev.org/

Wednesday, November 22, 2006

Casillas rurales vs. urbanas en el PREP

La semana pasada estuve en un seminario sobre el PREP en el IFE.  En una de las mesas en las que participé surgió la pregunta: "¿Cómo sabemos si la demora de las casillas rurales en verdad tuvo un impacto significativo en el flujo de datos del PREP?"


En el análisis de estadística descriptiva que hice meses antes era obvio que las casillas urbanas llegaron antes, en promedio, que las rurales... y que este sesgo ayudaba a explicar la ventaja inicial (y decreciente) de Calderón sobre AMLO durante la duración del PREP. 


¿Cómo podemos verificar esto estadísticamente, más allá de las gráficas?  Comparemos el tiempo promedio de cada tipo de casillas en ingresar al PREP:


. by casilla: summ horasdec  (# horas que tardó cada casilla en ingresar al PREP)

----------------------------------------------------------------------

-> casilla_rural = 0   (casillas urbanas)

    Variable |       Obs        Mean    Std. Dev.       Min        Max

-------------+--------------------------------------------------------

    horasdec |     85221    5.115121    2.764698          0      24.87

-> casilla_rural = 1   (casillas rurales)

    horasdec |     32066    7.436029    3.501121          0       24.9


Como vemos las casillas urbanas llegaron 7.43 - 5.11 = 2.32 horas antes que las rurales.   La varianza de las casillas rurales es mayor, además. ¿Será una diferencia significativa? Podemos hacer un t-test de medias o bien una regresión: 


Dep Var: num. de horas que tarda casilla en aparecer en el PREP...

IndepVar: Dummy  casilla_rural/urbana  


. regress  horasdec casilla_rural  

      Source |       SS       df       MS              Number of obs =  117287

-------------+------------------------------           F(  1,117285) =14093.54

       Model |  125504.017     1  125504.017           Prob > F      =  0.0000

    Residual |   1044431.6117285  8.90507397           R-squared     =  0.1073

-------------+------------------------------           Adj R-squared =  0.1073

       Total |  1169935.62117286  9.97506622           Root MSE      =  2.9841

------------------------------------------------------------------------------

    horasdec |      Coef.   Std. Err.      t    P>|t|     [95% Conf. Interval]

-------------+----------------------------------------------------------------

casilla_ru~l |   2.320909   .0195501   118.72   0.000     2.282591    2.359226

       _cons |   5.115121   .0102222   500.39   0.000     5.095085    5.135156

------------------------------------------------------------------------------


Como se aprecia, las casillas rurales "nada más" están a 118 errores estándar de distancia de las urbanas...  Pero seamos más rigurosos: Veamos si la dummy rural sobrevive al controlar por 32 dummies estatales--a la mejor la heterogeneidad estatal elimina la dicotomía rural/urbano:


. areg horasdec casilla, abs(edo)

                                                       Number of obs =  117287

                                                       F(  1,117254) =12373.15

                                                       Prob > F      =  0.0000

                                                       R-squared     =  0.1945

                                                       Adj R-squared =  0.1942

                                                       Root MSE      =   2.835


------------------------------------------------------------------------------

    horasdec |      Coef.   Std. Err.      t    P>|t|     [95% Conf. Interval]

-------------+----------------------------------------------------------------

casilla_ru~l |   2.228325   .0200327   111.23   0.000     2.189061    2.267589

       _cons |   5.140433    .009926   517.88   0.000     5.120978    5.159888

-------------+----------------------------------------------------------------

         edo |     F(31, 117254) =    409.380   0.000          (32 categories)


El coeficiente de diferencia entre casillas rurales y urbanas baja de 2.3 a 2.2 horas.   Pero si esto aún no nos convence, podemos controlar por 300 dummies distritales--quizá la heterogeneidad distrital elimina o absorbe la dicotomía rural/urbano:


. areg horasdec casilla, abs(edodist)

                                                       Number of obs =  117287

                                                       F(  1,116986) = 4269.59

                                                       Prob > F      =  0.0000

                                                       R-squared     =  0.3432

                                                       Adj R-squared =  0.3415

                                                       Root MSE      =  2.5629

------------------------------------------------------------------------------

    horasdec |      Coef.   Std. Err.      t    P>|t|     [95% Conf. Interval]

-------------+----------------------------------------------------------------

casilla_ru~l |   1.373901   .0210263    65.34   0.000      1.33269    1.415112

       _cons |    5.37403   .0094366   569.49   0.000     5.355535    5.392526

-------------+----------------------------------------------------------------

     edodist |    F(299, 116986) =    140.532   0.000         (300 categories)


Como vemos, resulta que aún controlando por heterogeneidad distrital, el factor rural añade 1.37 horas de demora promedio frente a las casillas urbanas. Es decir, al interior de cada distrito, las casillas rurales demoraron 1.37 horas más en ser procesadas que las urbanas.  En los tres casos analizados arriba, este impacto es estadísticamente significativo a niveles (muy) inferiores al 1%.


Sobra decir que este no es el análisis más exahustivo posible, pero sí es el análisis más básico y sencillo que podemos hacer con los datos del IFE disponibles a la fecha.  Con más datos, podría estimarse un modelo mucho mejor especificado.
Monday, November 13, 2006

World economic history in a snapshot

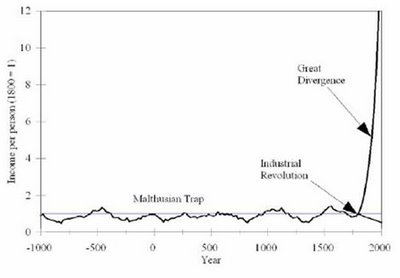
In case you have not been paying attention lately, this is the economic history of the world over the last 3000 years:

This is from Gregory Clark’s A Farewell to Alms: A Brief Economic History of the World (forthcoming in 2007 from Princeton). You can find some sample chapters, and lots of related papers, in his website at the Institute of Governmental Affairs at UC-Davis. Here’s an excerpt from the book’s intro:

The basic outline of world economic history is surprisingly
simple. Indeed it can be summarized in one diagram: figure 1.1 (see above).
Before 1800 income per person – the food, clothing, heat, light,
housing, and furnishings available per head - varied across societies
and epochs. But there was no upward trend. A simple but
powerful mechanism explained in this book, the Malthusian Trap,
kept incomes within a range narrow by modern standards.
Thus the average inhabitant in the world of 1800 was no better
off than the average person of 100,000 BC. Indeed, most
likely, consumption per person declined as we approached 1800.
The lucky denizens of wealthy societies such as eighteenth century
England or the Netherlands managed a material life style equivalent
to the Neolithic. But the vast swath of humanity in East and
South Asia, particularly in Japan and in China, eked out a living in
conditions that seem to have been significantly poorer than those
of cavemen.

(…)

The Industrial Revolution, a mere 200 years ago, changed
forever the possibilities for material comfort. Incomes per person
began a sustained growth in a favored group of countries around
1820. Now in the richest of the modern economies living standards
are 10-20 times better than was average in the world of
1800. Further the biggest beneficiary of the Industrial Revolution
has so far been the poor and the unskilled, not the typically
wealthy owners of land or capital, or the educated. Within the
rich economies of our world there is not only more for everyone,
but lots more for the bottom strata.

Wednesday, November 08, 2006

US 2006 Election Results--Democrats strike back

These are results from CNN as of this evening.
 
33 at stake, 1 undecided
51 Dem, 50 GOP needed for majority
PARTY NOT UP TOTAL GAIN/LOSS
GOP
40 seats 49 -5
DEM
27 seats 50 5
IND
0 seats 0 0
Updated: 1:18 p.m. ET
 
435 at stake, 10 undecided (yielding Republican) 
218 needed for majority
PARTY TOTAL GAIN/LOSS
GOP
196 -28
DEM
229 29
IND
0 -1
Updated: 4:21 p.m. ET
 
36 states at stake, MI undecided (yielding Republican)
PARTY NOT UP TOTAL GAIN/LOSS
GOP
6 states 21 -6
DEM
8 states 28 6
IND
0 seats 0 0
Updated: 1:19 p.m. ET
 
This graph on recent US election history is from the Washington Post:

Republicans have controlled both chambers since 1994, except during a brief period when the Democrats held the Senate.